Chapter 7 Fairness and acceptability
7.1 In a nutshell
Following the Behaviour as a Lens principle (Hallsworth 2023aHallsworth, Michael. 2023a. A Manifesto for Applying Behavioural Science. The Behavioural Insights Team. https://www.bi.team/publications/a-manifesto-for-applying-behavioral-science/.), the behavioural approach extends beyond the design of a policy intervention itself. In this chapter, I examine how behavioural insights are relevant for designing policies which will be both efficient and accepted by the public, thus entering the realm of political science. Our key value added to this space is probably our understanding of reciprocity as the main pillar in the assessments of fairness by the public — and not the total utility criterion commonly use in economic approaches.
7.2 Efficient yet unpopular policies
The traditional approach of policy-making in economics is that of the benevolent social planner, whose objective function is to maximize the sum of individual utility functions — or a social aggregated function. The underlying argument is that if you increase the total utility, there exists some form of redistribution which, combined with your policy, leads to an improvement in the sense of Pareto (everyone is at least as well off as before the change, and some people are strictly better off). This has been typically the thinking around international trade: aggregated gains to trade, through lower prices, are far greater than the monetary cost of lost jobs. On paper, it should be fairly easy to tax winners (lightly, because there are so many of them) to fund re-training schemes for people who lost their jobs to offshoring.41 While the trade deficit with China looms large in representations, remember that the bulk of international trade is between similar countries. Lots of French manufacturing jobs where offshored to Germany or the Czech Republic. Actual implementations of such policies have remained elusive, not least because price decreases are not readily observable, while new taxation is salient, making redistributive policies a tough sell.
This draws the attention to the individual-level acceptability of policies. If policies requiring large redistribution schemes are tricky, policies which benefit an overwhelming majority of people at an acceptable costs to some, or whose gains dwarf any costs, should be easy sells to self-interested voters, don’t they? Two prominent examples show that rational self-interest is not sufficient to assess acceptability. Information, beliefs and values all come into play when assessing one’s support for a given policy.
7.2.1 The estate tax
For years, the estate tax (or inheritance) tax has been the prime example of a policy which almost all economists support on efficiency grounds, and yet deeply unpopular.42 Strictly speaking, these are two different things, since the estate tax is levied on the estate itself, while the inheritance tax is levied on heirs. This legal distinction is however not relevant here. The principle of an estate tax is simple: when someone dies, heirs must relinquish a share of the total value of the inheritance to the State. Most of the time, there is a sizable franchise (€ 100 000 per child an per parent in the case of a direct inheritance in France), lots of loopholes (life insurance contracts), and the rate of the tax typically depends on the closeness of kin. By construction, the inheritance tax raises no solvency issue, since its amount is a share of whet heirs will get. The main practical obstacle can be liquidity issues, for example in the case of a family home.43 One may notice that a household struggling to pay for a reasonable inheritance tax on a family home may not have the resources required for the upkeep of the said home.
In practice and in most jurisdictions, most people will never pay any estate tax. In France, about 1 inheritance out of 10 is subject to taxation, mainly because the franchise threshold exempts most of inheritances. On paper, it should thus be a no-brainer in terms of majority acceptance: most people will never have to pay, and only the wealthy will be ever subject to it. Yet, it consistently ranks among the most unpopular pieces of taxation.44 In sharp contrast with the Zucman tax.
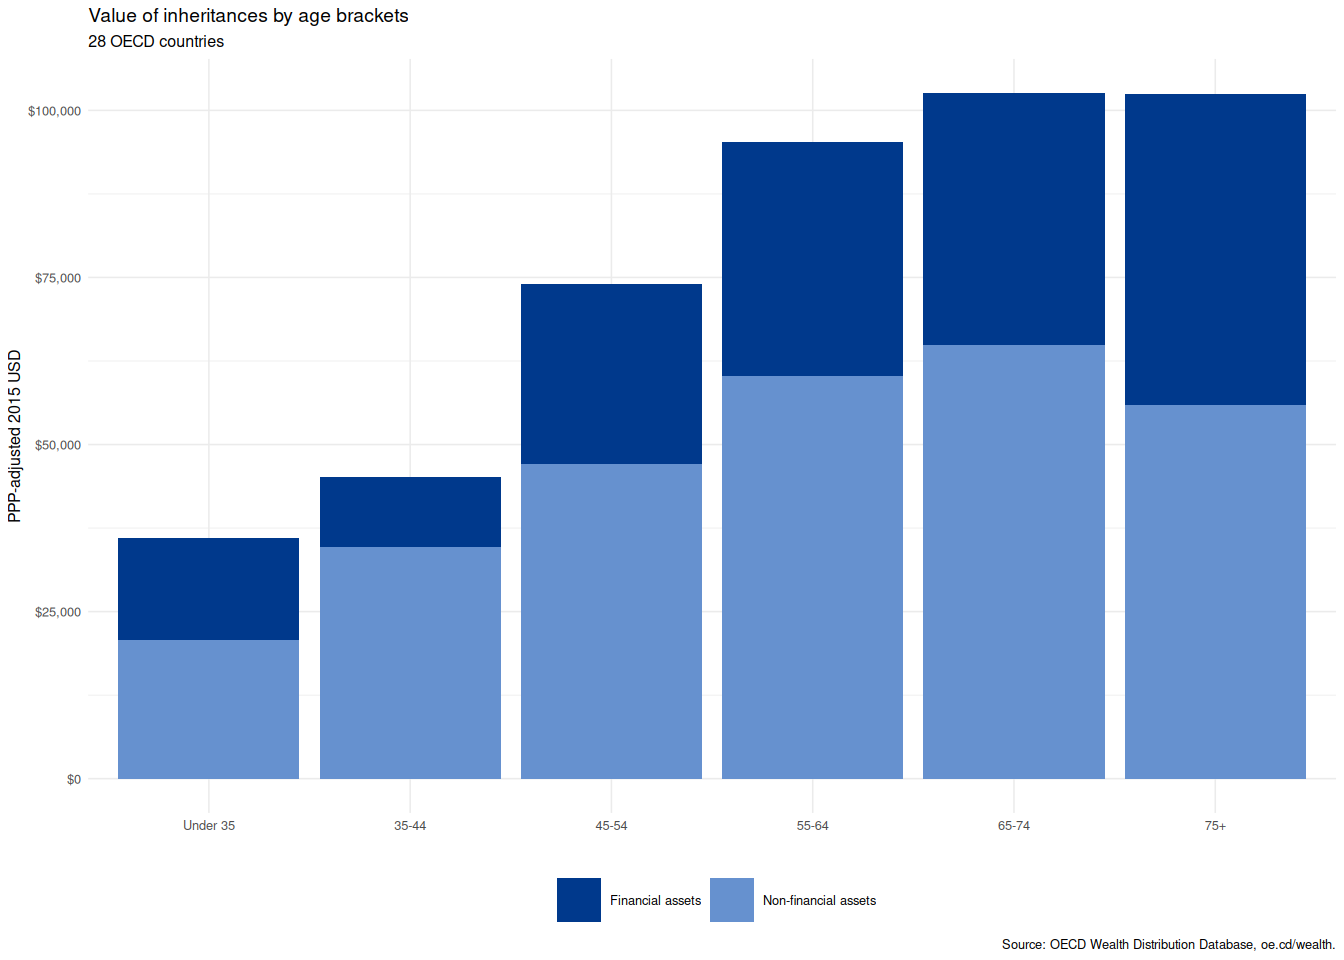
Figure 7.1: Value of inheritances by age brackets in OECD countries. Mean value of inheritance is below the franchise level applicable in most OECD countries.
In terms of efficiency, it also shines. Since the time of death is difficult to know, it is difficult to quickly optimize your wealth allocation with tax avoidance in mind. This has to be done over a length of time, which makes the process amenable to economic incentives, e. g. exemptions for desirable types of investments or for earlier transfer to younger generations. It is also relatively easy to collect since collection is infrequent (once in a lifetime) and occurs when a complete appraisal of the taxed wealth must be performed anyway to divide the inheritance. We saw how thresholds can make it progressive, contributing to wealth redistribution. It also provides incentives to invest in non-taxable investments – human capital, that is, education – rather than physical assets. As a result, it has been endorsed by otherwise very right-wing, libertarian thinkers such as Milton Friedman.
It seems that cognitive motives are at the root of the estate tax unpopularity. Firstly, part of the problem is purely a matter of information. Most people ignore the existence of a franchise, or how high its amount is. Secondly, the lack of information combines with a form of optimism bias, leading people to grossly over-estimate the value of their prospective inheritance. On the real estate side, typically the main asset, transactions are infrequent, and the value appraisal is often clouded by emotional overtones, especially for family dwellings. For financial assets, their current value is often not a matter of conversation within families, and people often fail to factor in the cost of later years care (e. g. home adaption, nursing homes). The issue is further compounded by the high salience of people who will (loudly) complain about the estate tax they had to pay, compared to the discretion of most heirs.
Indeed, providing people with realistic expected values for their inheritance and the associated tax (non-)payment significantly boosts acceptance of the estate tax. In other terms, beside the design of a public policy, design of the provision of information about the impacts of that policy can be a key element for a successful policy change.
7.2.2 The carbon tax
Is the carbon tax a similar issue? From an economic perspective, it should be the go-to device to curb carbon dioxide emissions: it forces agents to internalize the cost of their choices, both in production technologies and in consumption behaviours. Statically, is displaces consumption from high-emissions to low-emission goods and services, and dynamically provides incentives to less emitting production technologies. In terms of immediate impacts, the products of this tax can be allocated in ways which compensate lower-income households, and it can be ramped up over time at a pace consistent with each sector’s capacity to adapt (for a comprehensive view of economic argument in favour of a carbon tax in French, see (Guesnerie 2010Guesnerie, Roger. 2010. Pour Une Politique Climatique Globale. Opuscules Du Cepremap 20. Rue d’Ulm / Cepremap. http://www.cepremap.fr/publications/pour-une-politique-climatique-globale-blocage-et-ouvertures/.; Henriet and Schubert 2021Henriet, Fanny, and Katheline Schubert. 2021. La transition énergétique. Rue d’Ulm / Cepremap.; Schubert 2009Schubert, Katheline. 2009. Pour La Taxe Carbone. Opuscules Du Cepremap 18. Rue d’Ulm / Cepremap. http://www.cepremap.fr/publications/pour-la-taxe-carbone-la-politique-economique-face-a-la-menace-climatique/.)). Yet, it is deeply unpopular. While the Convention citoyenne pour le climat adopted most of experts’ advised policies, it excluded a carbon tax.
In France, the main cause of this opposition is not climate change denialism. As featured in the figures below from (Douenne and Fabre 2019Douenne, Thomas, and Adrien Fabre. 2019. Opinions Des Français Sur Les Politiques Climatiques. No. 1906. CEPREMAP. http://www.cepremap.fr/depot/2019/11/docweb1906.pdf.) (see also (Douenne and Fabre 2022Douenne, Thomas, and Adrien Fabre. 2022. “Yellow Vests, Pessimistic Beliefs, and Carbon Tax Aversion.” American Economic Journal: Economic Policy 14 (1): 81–110. https://doi.org/10.1257/pol.20200092.)), 92% of French respondent acknowledge that climate change is real, and 72% that it is mainly of anthropic origin. At the same time, 81% think the effects of climate change are serious or worse.
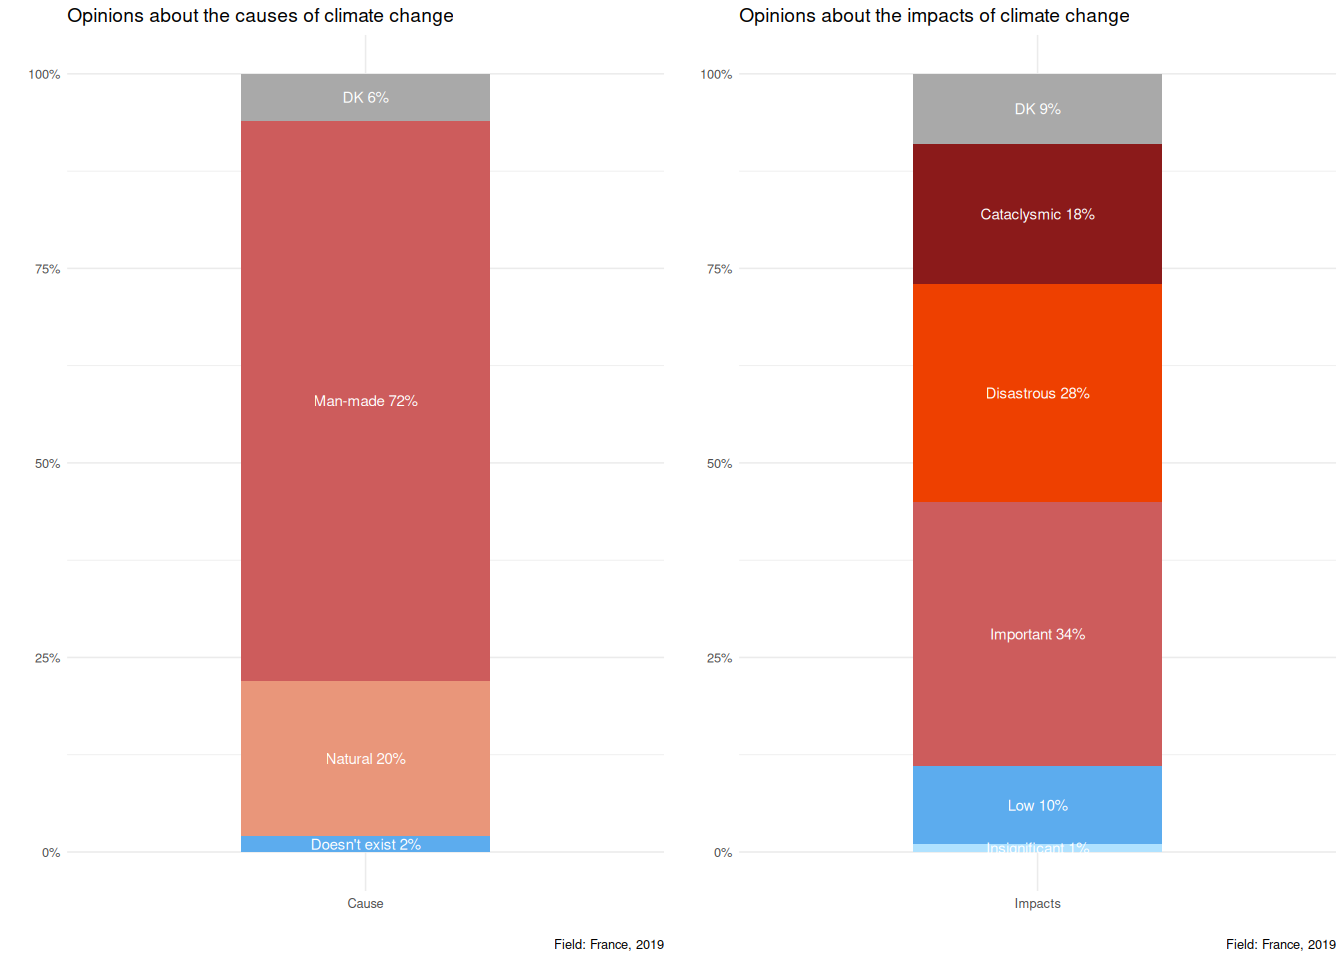
Of course, there is some amount of partisan divide on the topic, but it is lower that the Democrat-Republican divide in the US, being mainly limited to far-right parties (Blanc 2023Blanc, Corin. 2023. Positionnement Politique Et Acceptation Des Mesures Environnementales : Le Cas de l’extrême Droite. Nos. 2023-15. CEPREMAP. https://www.cepremap.fr/2023/12/positionnement-politique-et-acceptation-des-mesures-environnementales-le-cas-de-lextreme-droite/.). In fact, 63% endorse everyone’s responsibility for fighting climate change, over some foreign countries (47%), wealthier people (42%) or even governments (25%). There is thus a high level of awareness, coupled with a sense of responsibility. A wholly different picture from the estate tax. Yet, approval of a carbon tax is as low as 18% of respondents, even in schemes where the proceeds would be redistributed in order to offset the loss of purchasing power, making it revenue-neutral to both the state and households.
Inefficiency is not a the main concern (only 37% of respondents mention it): main motives revolve around the idea it’ll harm the economic welfare of some people, starting with people living in the countryside (47% of respondents mention this item) or poorer people (29%). In terms of broad social groups, most people think that the middle class (in the French sense: 82% of the population self-identify as middle class) will be the main looser from a carbon tax, closely followed by poorer people.
If we flip the question around, alternatives to the carbon tax deemed the more acceptable largely favour norms and regulations (on buildings and automotive vehicles), and reject taxation (on meat or urban tolls), with the exception of a tax on air travel.
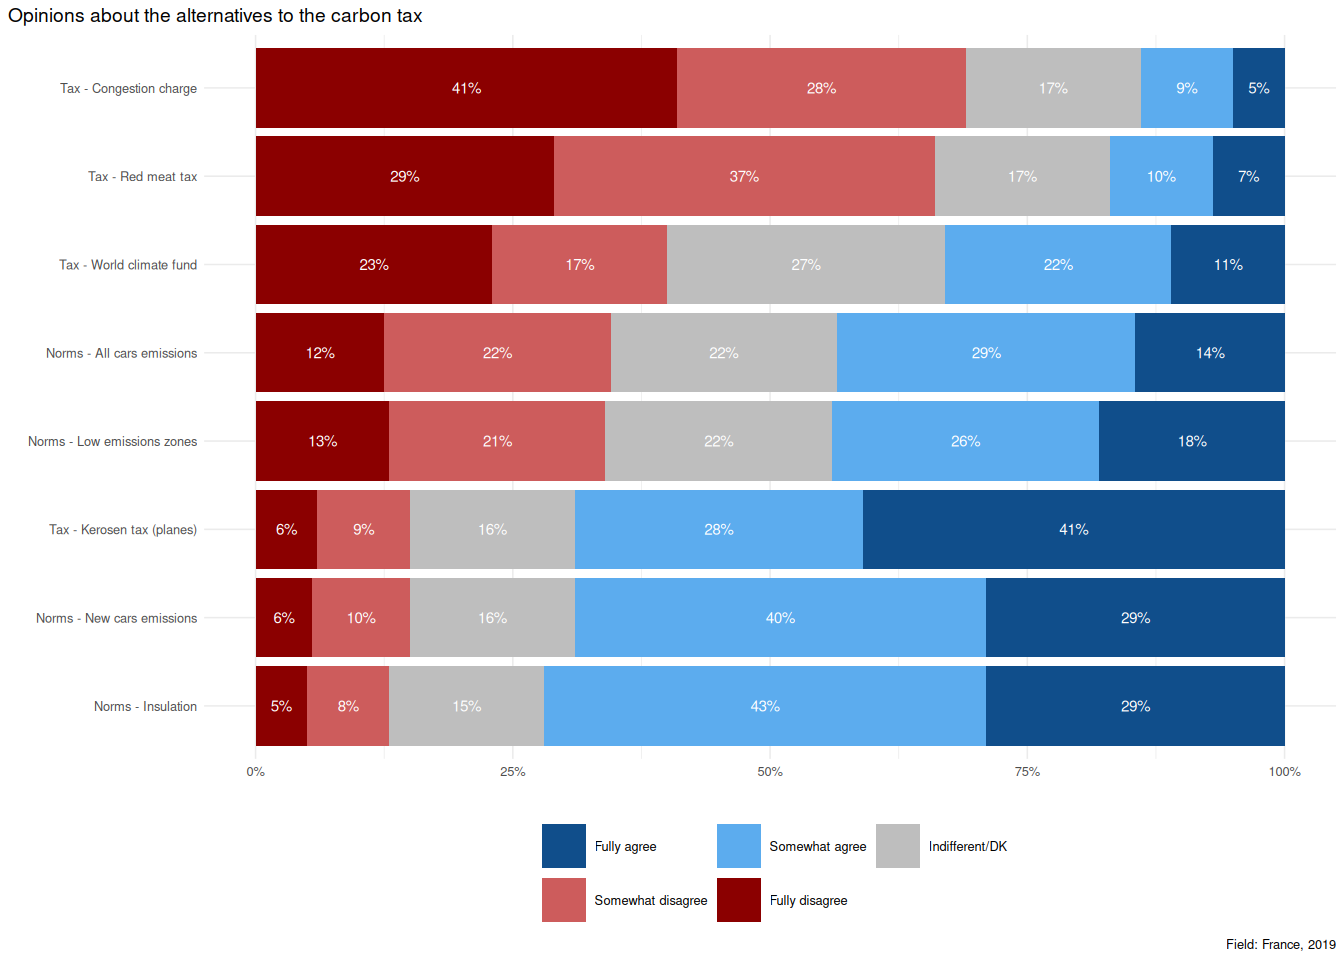
There is a strong aversion to the idea that having more money allows you to continue undesirable behaviours, and little regard for efficiency elements – the preferred alternatives are actually the less efficient ways to reduce carbon emissions. The distribution of the impact is actually only a medium importance item: compensating people loosing from a carbon tax comes only in the middle of the range of what would be acceptable.
The core issue in the opposition to the carbon tax in France is thus a matter of fairness. French people feel it not fair to tax people for choices they made (such as a house in the countryside, leading to emission due to fuel heating and two-cars transportation) without good knowledge of their consequences. When they purchased their suburban home, it was supposed to be the best environment to raise their children, less polluted than city centres. It does not feel fair to tax people who already have difficulties balancing their budget when richer people can get away with frequent flying. It goes above and beyond the mere loss of purchasing power due to the tax. It is a matter of moral right or wrong: who shall pay?
7.3 What does “Fairness” means?
If people gauge policies using fairness norms, we should investigate what they mean by it. We saw in a previous lecture that people routinely engage into cooperative behaviours, sometimes at a private costs, including enforcing social norms. Even with our specialized faculties, assessing why a person cooperates is always tricky, and implies a complex theory of mind. We must infer from various cues if the person is a genuine cooperator, investing in a long-term reciprocal relation, or merely an opportunist ready to sacrifice me if the payoff of doing so is high enough. Fairness perception has then something to do with the reward of good intention (the person is a genuine cooperator) and punishment of bad ones, to strengthen cooperative equilibria. This approach is at odds with the individual consequentialism of utilitarian approaches, but also with theories of justice such as Rawls’, where societies are judged on the wellbeing of their worse off members. Thus, the area of inquiries moves from principles-based fairness assessments to empirical questions: how do people make their fairness judgements? Are they consistent with conditional cooperative equilibria?
At a smaller scale, fairness will refer to the feeling that an intervention respects global and local norms of equity, including a regard for agency (Banerjee et al. 2024Banerjee, Sanchayan, Till Grüne-Yanoff, Peter John, and Alice Moseley. 2024. “It’s Time We Put Agency into Behavioural Public Policy.” Behavioural Public Policy 8 (4): 789–806. https://doi.org/10.1017/bpp.2024.6.). Disregarding this aspect can break an experiment. A decade ago, Élise Huillery conducted one of the first randomised evaluation of a new policy for jobseekers, at Pôle Emploi. The identification strategy was to randomize whom would be directed to this policy among jobseekers. A large share of job consellors resisted this strategy, arguing that it was unfair. This claim of unfairness recovered three motives:
- An efficiency motive: given a limited number of slots in the experimental condition, they felt it was their duty to maximize the use of public money, and thus directed to the treatment group only the candidates they felt the most likely to benefit from it.
- A pure fairness motive: pure luck was deemed less fair than a first-come-first served method, which led to a temporal gap between the treatment and control group.45 French students may remember the uproar caused by a few random draws for the allocation of spots in fist year medical studies, which led to the establishment of Admission Post-bas, now ParcourSup.
- An agency issue, they felt their expertise in allocating jobseekers to the right program was disregarded. As a result, many ignored the instruction to allocate jobseekers with the right profile randomly to the treatment or control arms, and choose those they though would benefit the most. It thus became impossible to disentangle the program’s impact from a selection bias and a temporal gap.
The remainder of this section will thus cover how we can experimentally explore how people make moral judgements, how this impacts the way we frame policies to foster acceptance, and how criteria to make these judgments are subject to change over time and circumstances.
7.4 The trolley problem
In an experimental setting, the reference experiment to study perceptions of fairness is the trolley problem. It was initially introduced by (Foot 1967Foot, Philippa. 1967. “The Problem of Abortion and the Doctrine of the Double Effect.” Oxford Review 5: 5–15. https://philarchive.org/rec/FOOTPO-2.) in the context of the debate on abortion rights, and found its current form in (Thomson 1976Thomson, Judith Jarvis. 1976. “Killing, Letting Die, and the Trolley Problem.” The Monist 59 (2): 204–17. https://www.jstor.org/stable/27902416.). The idea is to confront people with a hard moral choice, where competing theories of justice provide differing predictions.
7.4.1 Canonical form
The canonical form of the trolley problem is:
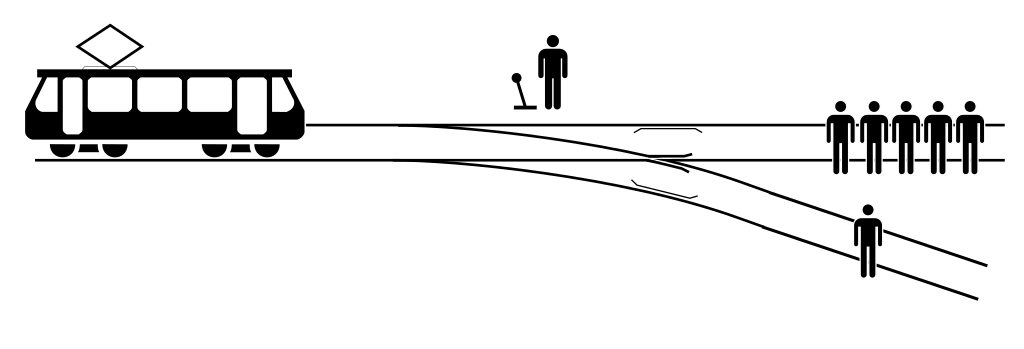 Figure 7.2: McGeddonVector: Zapyon, CC BY-SA 4.0, via Wikimedia Commons
There is a runaway trolley barreling down the railway tracks. Ahead, on the tracks, there are five people tied up and unable to move. The trolley is headed straight for them. You are standing some distance off in the train yard, next to a lever. If you pull this lever, the trolley will switch to a different set of tracks. However, you notice that there is one person on the side track. You have two (and only two) options:
- Do nothing, in which case the trolley will kill the five people on the main track.
- Pull the lever, diverting the trolley onto the side track where it will kill one person.
Which is the more ethical option? Or, more simply: What is the right thing to do?
If people were utilitarian (think homo economicus), there would be not hesitation: without more information, it is unlikely that the expected lifetime utility of one people is more than five times that of the tied-up people. Better save five than one. Other justice theories would lead to other choices: equalitarianism would use a random choice, with each person having an equal chance of being saved (5 chances out of 6 to pull the lever).
7.4.2 From the canonical form to variations
Before going to empirical results, it should be noted that people are sensitive to small variations in the setup. For example, (D’Olimpio 2016D’Olimpio, Laura. 2016. “The trolley dilemma: would you kill one person to save five?” The Conversation, June 3. http://theconversation.com/the-trolley-dilemma-would-you-kill-one-person-to-save-five-57111.) presents the problem as:
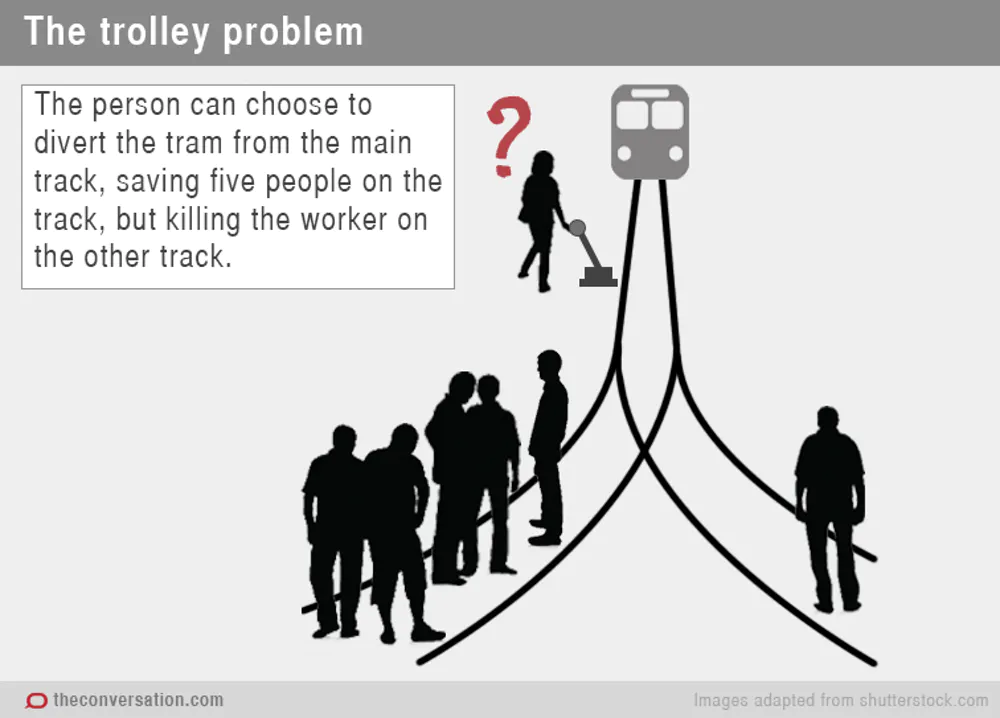 Figure 7.3: Trolley problem with a probably unintended variation, from d’Olimpio, 2016.
The person can choose to divert the tram from the main track, saving five people on the track, but killing the worker on the other track.
Although this form is often used, the precision that the lone person is a worker has an impact on the assessment of the situations. The five people on the main track may or may not have a good reason to be here, while the worker is doing his job. From an utilitarian point of view, it should not change anything.
Additional variations explore this sentitivity. In the Footbridge variation, you do not operate swicth, but may throw a large person on the track, thereby killing them but stopping the tram and saving the five others.
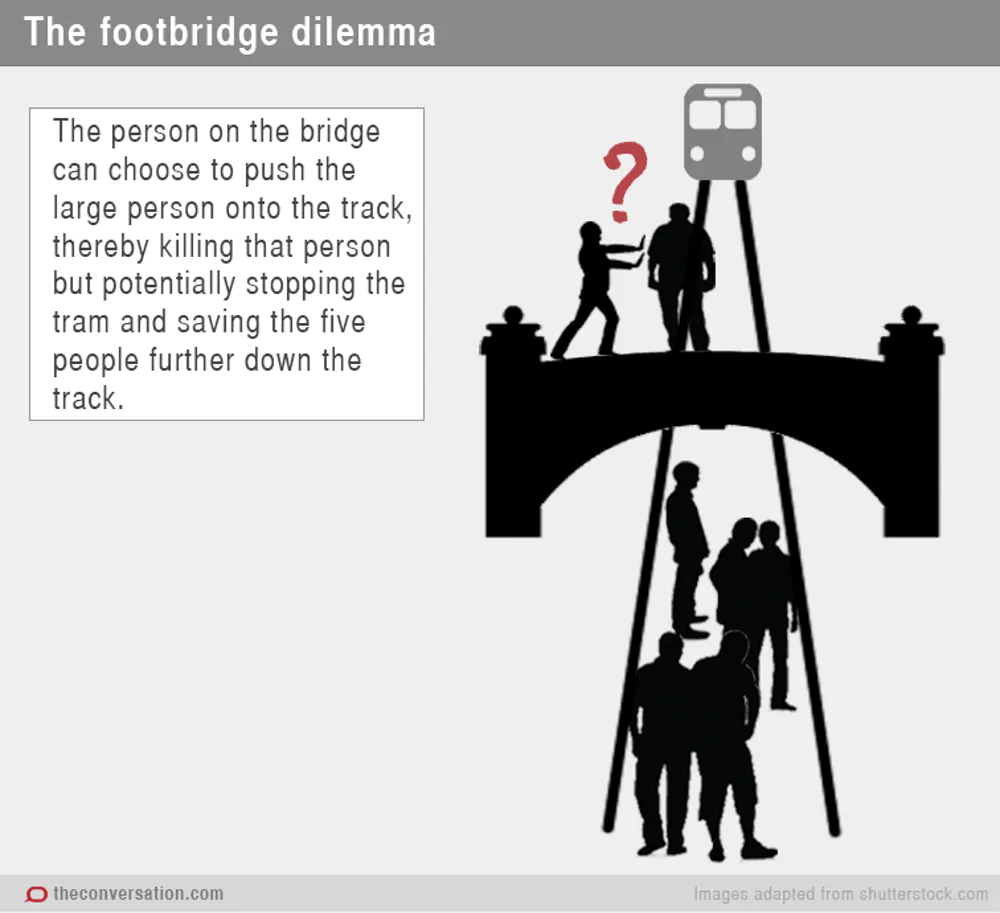 Figure 7.4: Footbridge dilemna, from d’Olimpio, 2016.
From an utilitarian point of view, it is again the very same problem, and the response should be identical.
7.4.3 Empirical results
As for the marshmallow test, there is a host of empirical experiments using the trolley problem. I’ll reference only one here, (Awad et al. 2020Awad, Edmond, Sohan Dsouza, Azim Shariff, Iyad Rahwan, and Jean-François Bonnefon. 2020. “Universals and Variations in Moral Decisions Made in 42 Countries by 70,000 Participants.” Proceedings of the National Academy of Sciences 117 (5): 2332–37. https://doi.org/10.1073/pnas.1911517117.), because it has a huge sample size (70 000 participants) and a large geographical breadth (42 countries).
Figure 7.5: Geographic coverage and scenarios images, Figure 1 from Awad et al., 2020.
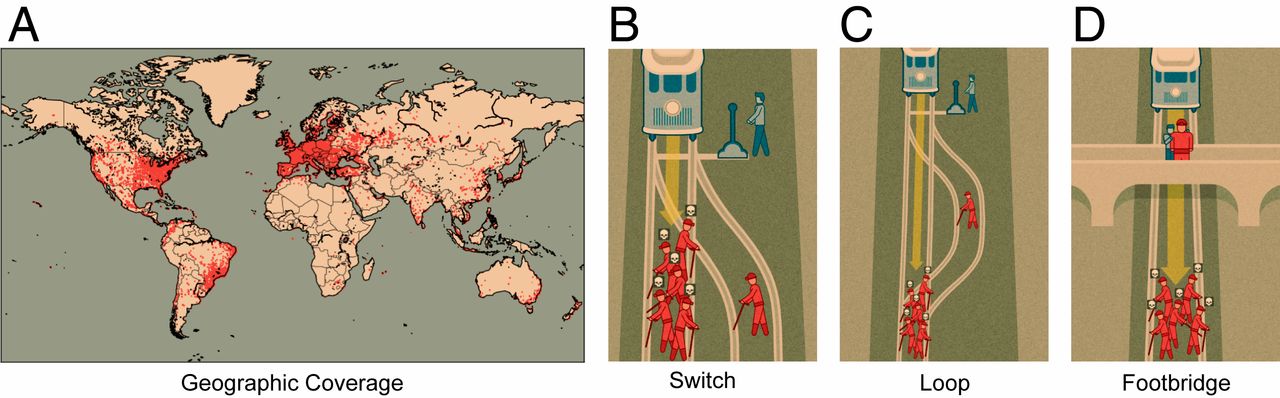
In addition to the Switch and Footbridge case, the team tested an intermediate setup, called the Loop, introduced in (Costa 1987Costa, Michael J. 1987. “Another Trip on the Trolley.” The Southern Journal of Philosophy 25 (4): 461–66. https://doi.org/10.1111/j.2041-6962.1987.tb01636.x.). In the Loop case, you may divert the tram to a track going back further to the main track. As in the Footbridge version, it will be the death of the person on the loop track which will stop the tram.
Their main results are that people are not utilitarian. They do not, by a wide margin perceive the three situations as identical. Broadly speaking, there are 20% of respondents who would not pull the switch in the canonical case. This propensity is about 10 percentage points higher for the loop case, showing that the two situations are understood as close, but not identical. The Footbridge case faces a much higher level of reluctance, with a small majority of respondents arguing it would be ethical to push the large bystander.
Figure 7.6: By-country shares of respondents who would flip the switch, by scenarion. Figure 2 from Awad et al., 2020.
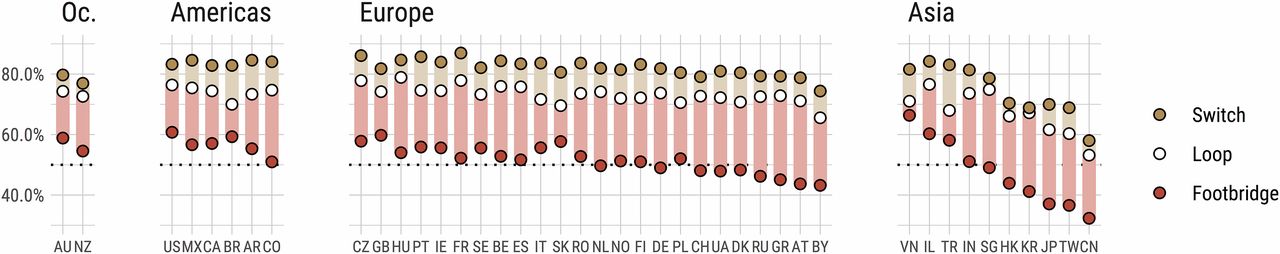
The results also show substantial variation within Europe, and even more so between continents and within Asia. Vietnamese respondents are the closest to the utilitarian perspective, with also the smallest gap between variations, while Chinese respondents report the lower propensity to sacrifice the lone person across variations. The authors link these variations with relational mobility within societies. The idea is that people agreeing to sacrifice one person to save others are identified as less trustworthy: you could be the lone person on the track or on the footbridge. Thus, such behaviour is more strongly selected against in society with low relational mobility, where such reputation durably harms your prospects, than in societies with high relational mobility, where you can more easily reconstruct a new cooperation network when you have been exposed as a defector in the previous one.
7.5 The Moral Machine Experiment
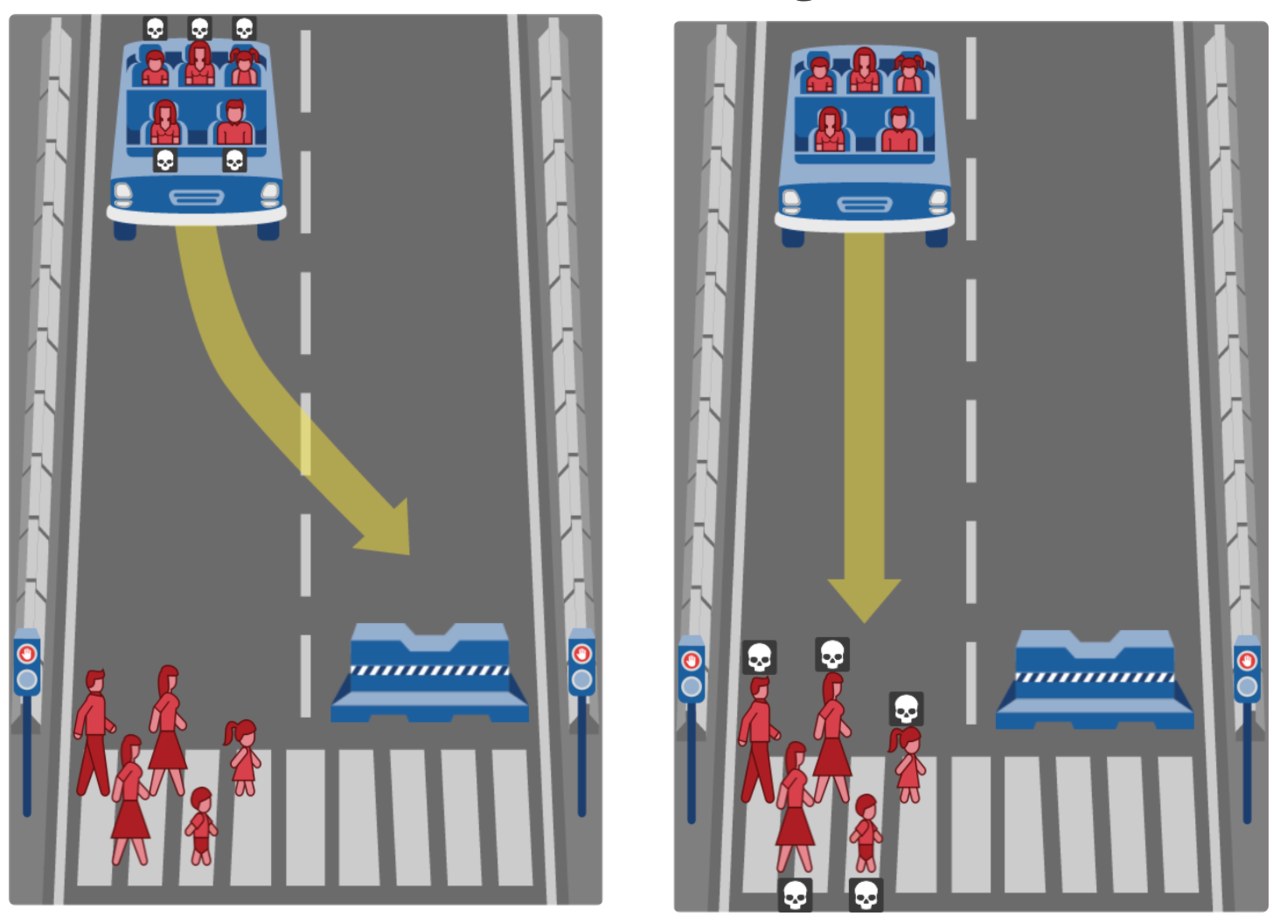 Figure 7.7: Example of choice set from Awad et al. 2018, Figure 1.
In this area, there is an even more ambitious experiment: the Moral Machine experiment. It leverages the broad reach of the Internet to conduct a huge-scale experiment on an enormous number of variations of the trolley problem. The team cunningly framed it as a survey on the decision rules which should drive autonomous vehicles’ algorithms.46 Just to be clear: at this stage, the challenge for autonomous driving is to have self-driving cars distinguish children in red from stop signs. To our knowledge, the existing encoded behaviour in this kind of situations is to shut down the self-driving module and let the vehicle owner deal with the consequences. Their setup is a testimony to the importance of design. They relied on simple graphics, to allow for low loading times even in countries with slow or unreliable Internet connections, internationalization (more than 10 languages) and gamification — you could design your own version of the dilemma and share it with other people.
The results, reported in (Awad et al. 2018Awad, Edmond, Sohan Dsouza, Richard Kim, et al. 2018. “The Moral Machine Experiment.” Nature 563 (7729, 7729): 59–64. https://doi.org/10.1038/s41586-018-0637-6.) include more than 40 million choices made in 233 countries. With such a number of observations, they can identify very small effect sizes, and test a wide range of variations: number of passengers and pedestrian, but also gender, age, social status, law abidance, body weights, being a pet47 One of the author told in a seminar that the introduction of pets had a further motive: boost the virality of the experiment, since internet is made of cats, etc. And all their data is publicly available. My personal account is that the effects are likely to be under-estimated. I took part in the experiment, but I skipped part of the tutorial. As a result, I failed to notice things such as body weights or the presence of traffic lights.
Figure 7.8: Graphical summary of the main results, from Awad et al. 2018.
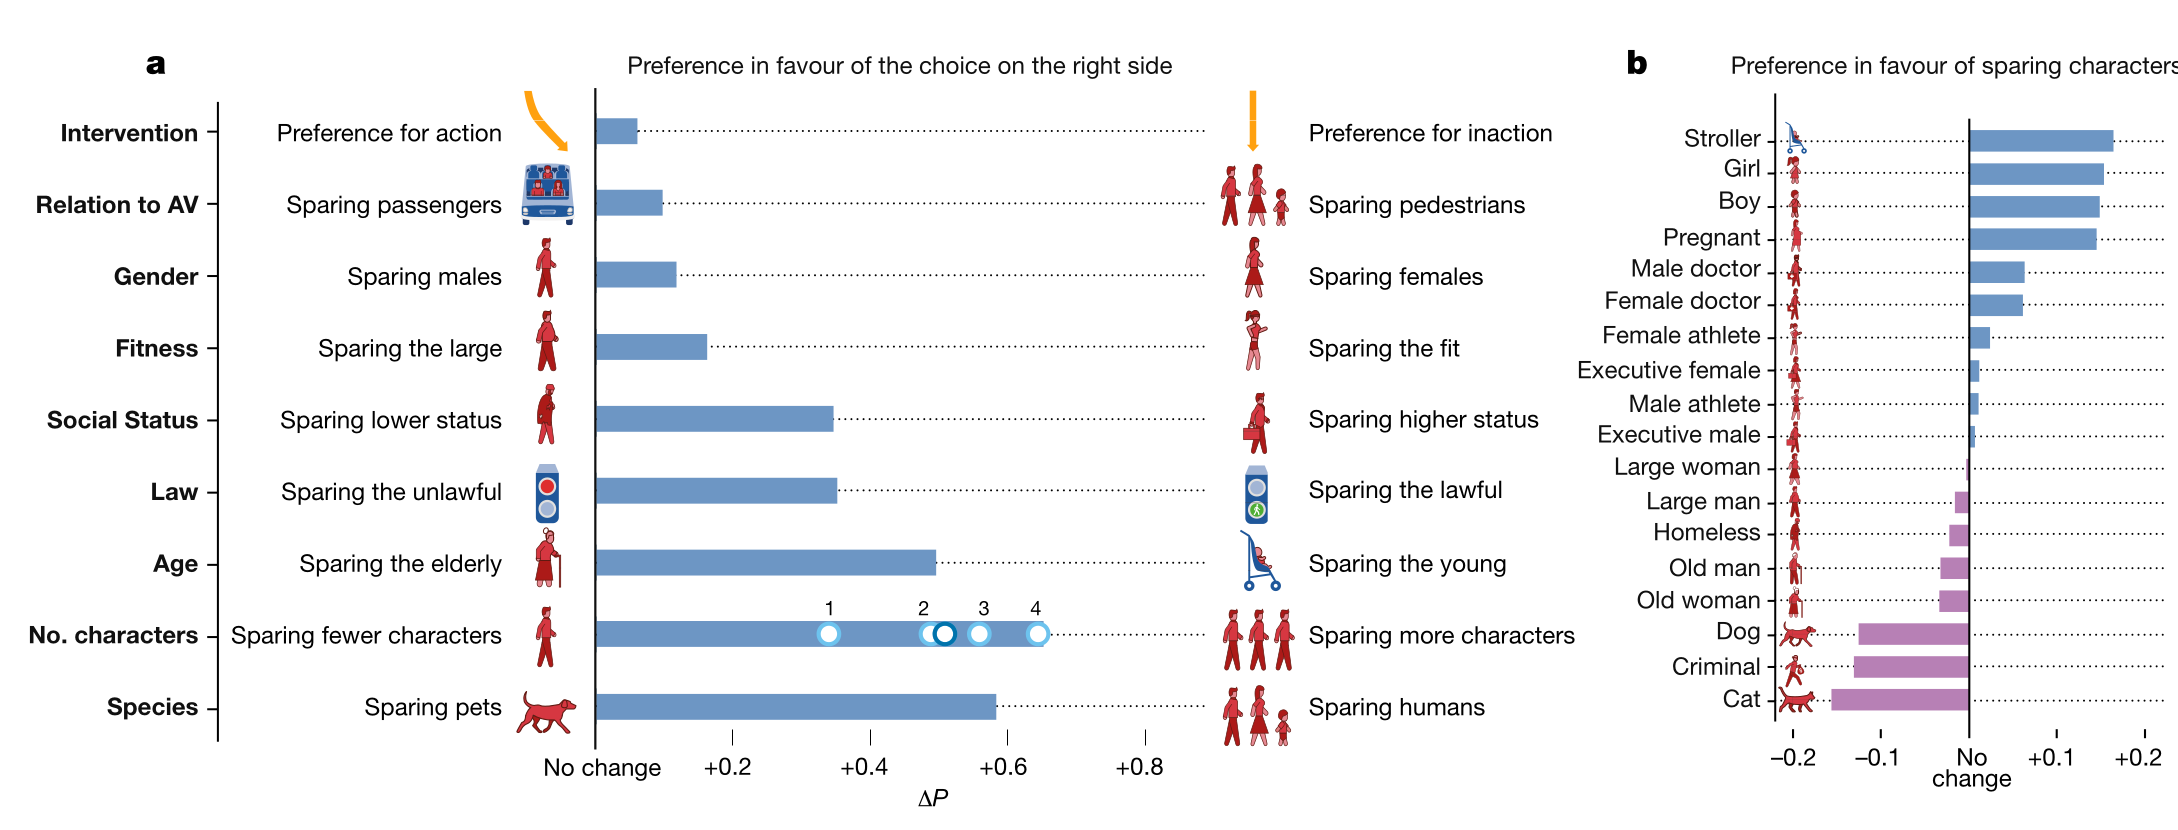
In terms of results, the main effects are that people prefer solutions sparing more people and sparing young people. The effect of social status in on par with the effect of law abidance. Preferences for fit people over large people and pedestrian over passengers are smaller, but still meaningful.
My take-away message from this detour is that basic norms of fairness and ethics vary across populations. If this is true for life-and-death situation, it is even more so for lower-stakes decisions. Thus, you should not presume to know how people will assess your intervention, from the motivation to the means. You should ask relevant people, and measure acceptability ex ante whenever possible.
7.6 Fairness and policies
Moving from the lab to the field, this section uses example to show how representations shape the perception of some high stakes policies.
7.6.1 Vaccine hesitancy
With the Covid-19 epidemic, vaccine hesitancy has moved from a fringe subject, fed by faked research48 Most notably on the purported link between the measles vaccine and autism., to a mass phenomenon. The Pew research center survey usefully breaks down representations about vaccines on perceived health benefits and perceived risks of side effects. Of course, the two are correlated, but far from perfectly. In France, the perception of benefits is relatively low (52%) for measles vaccine, but the perceptions that vaccines are safe is higher than in many comparably skeptical countries. In other words, the map of vaccine hesitancy is the result of the balance between perceived benefits and risks, and not only the former.
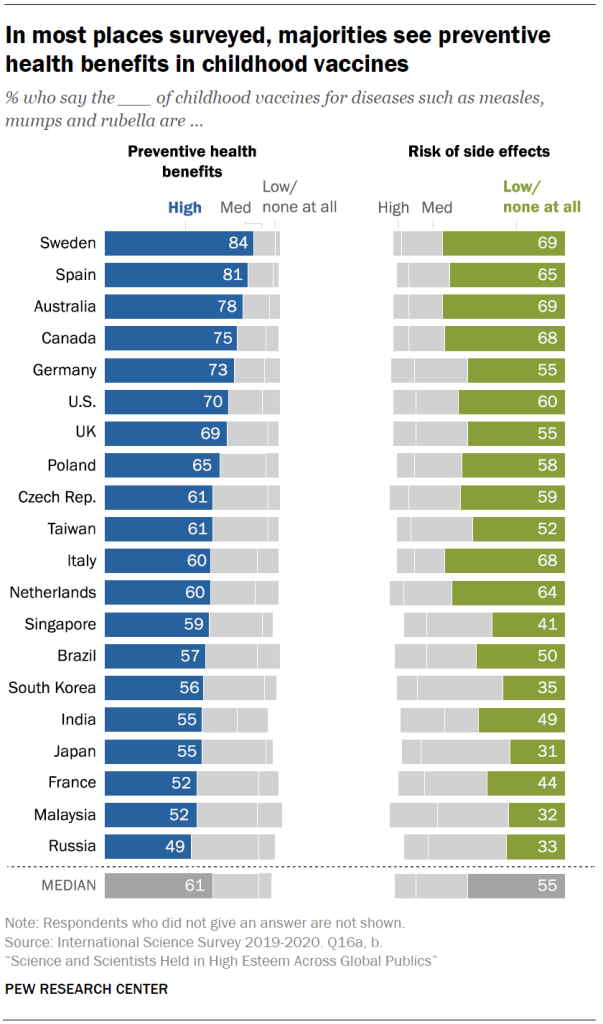 Figure 7.9: Perceived benefits and risks of vaccines, Pew Research Centrer, 2021.
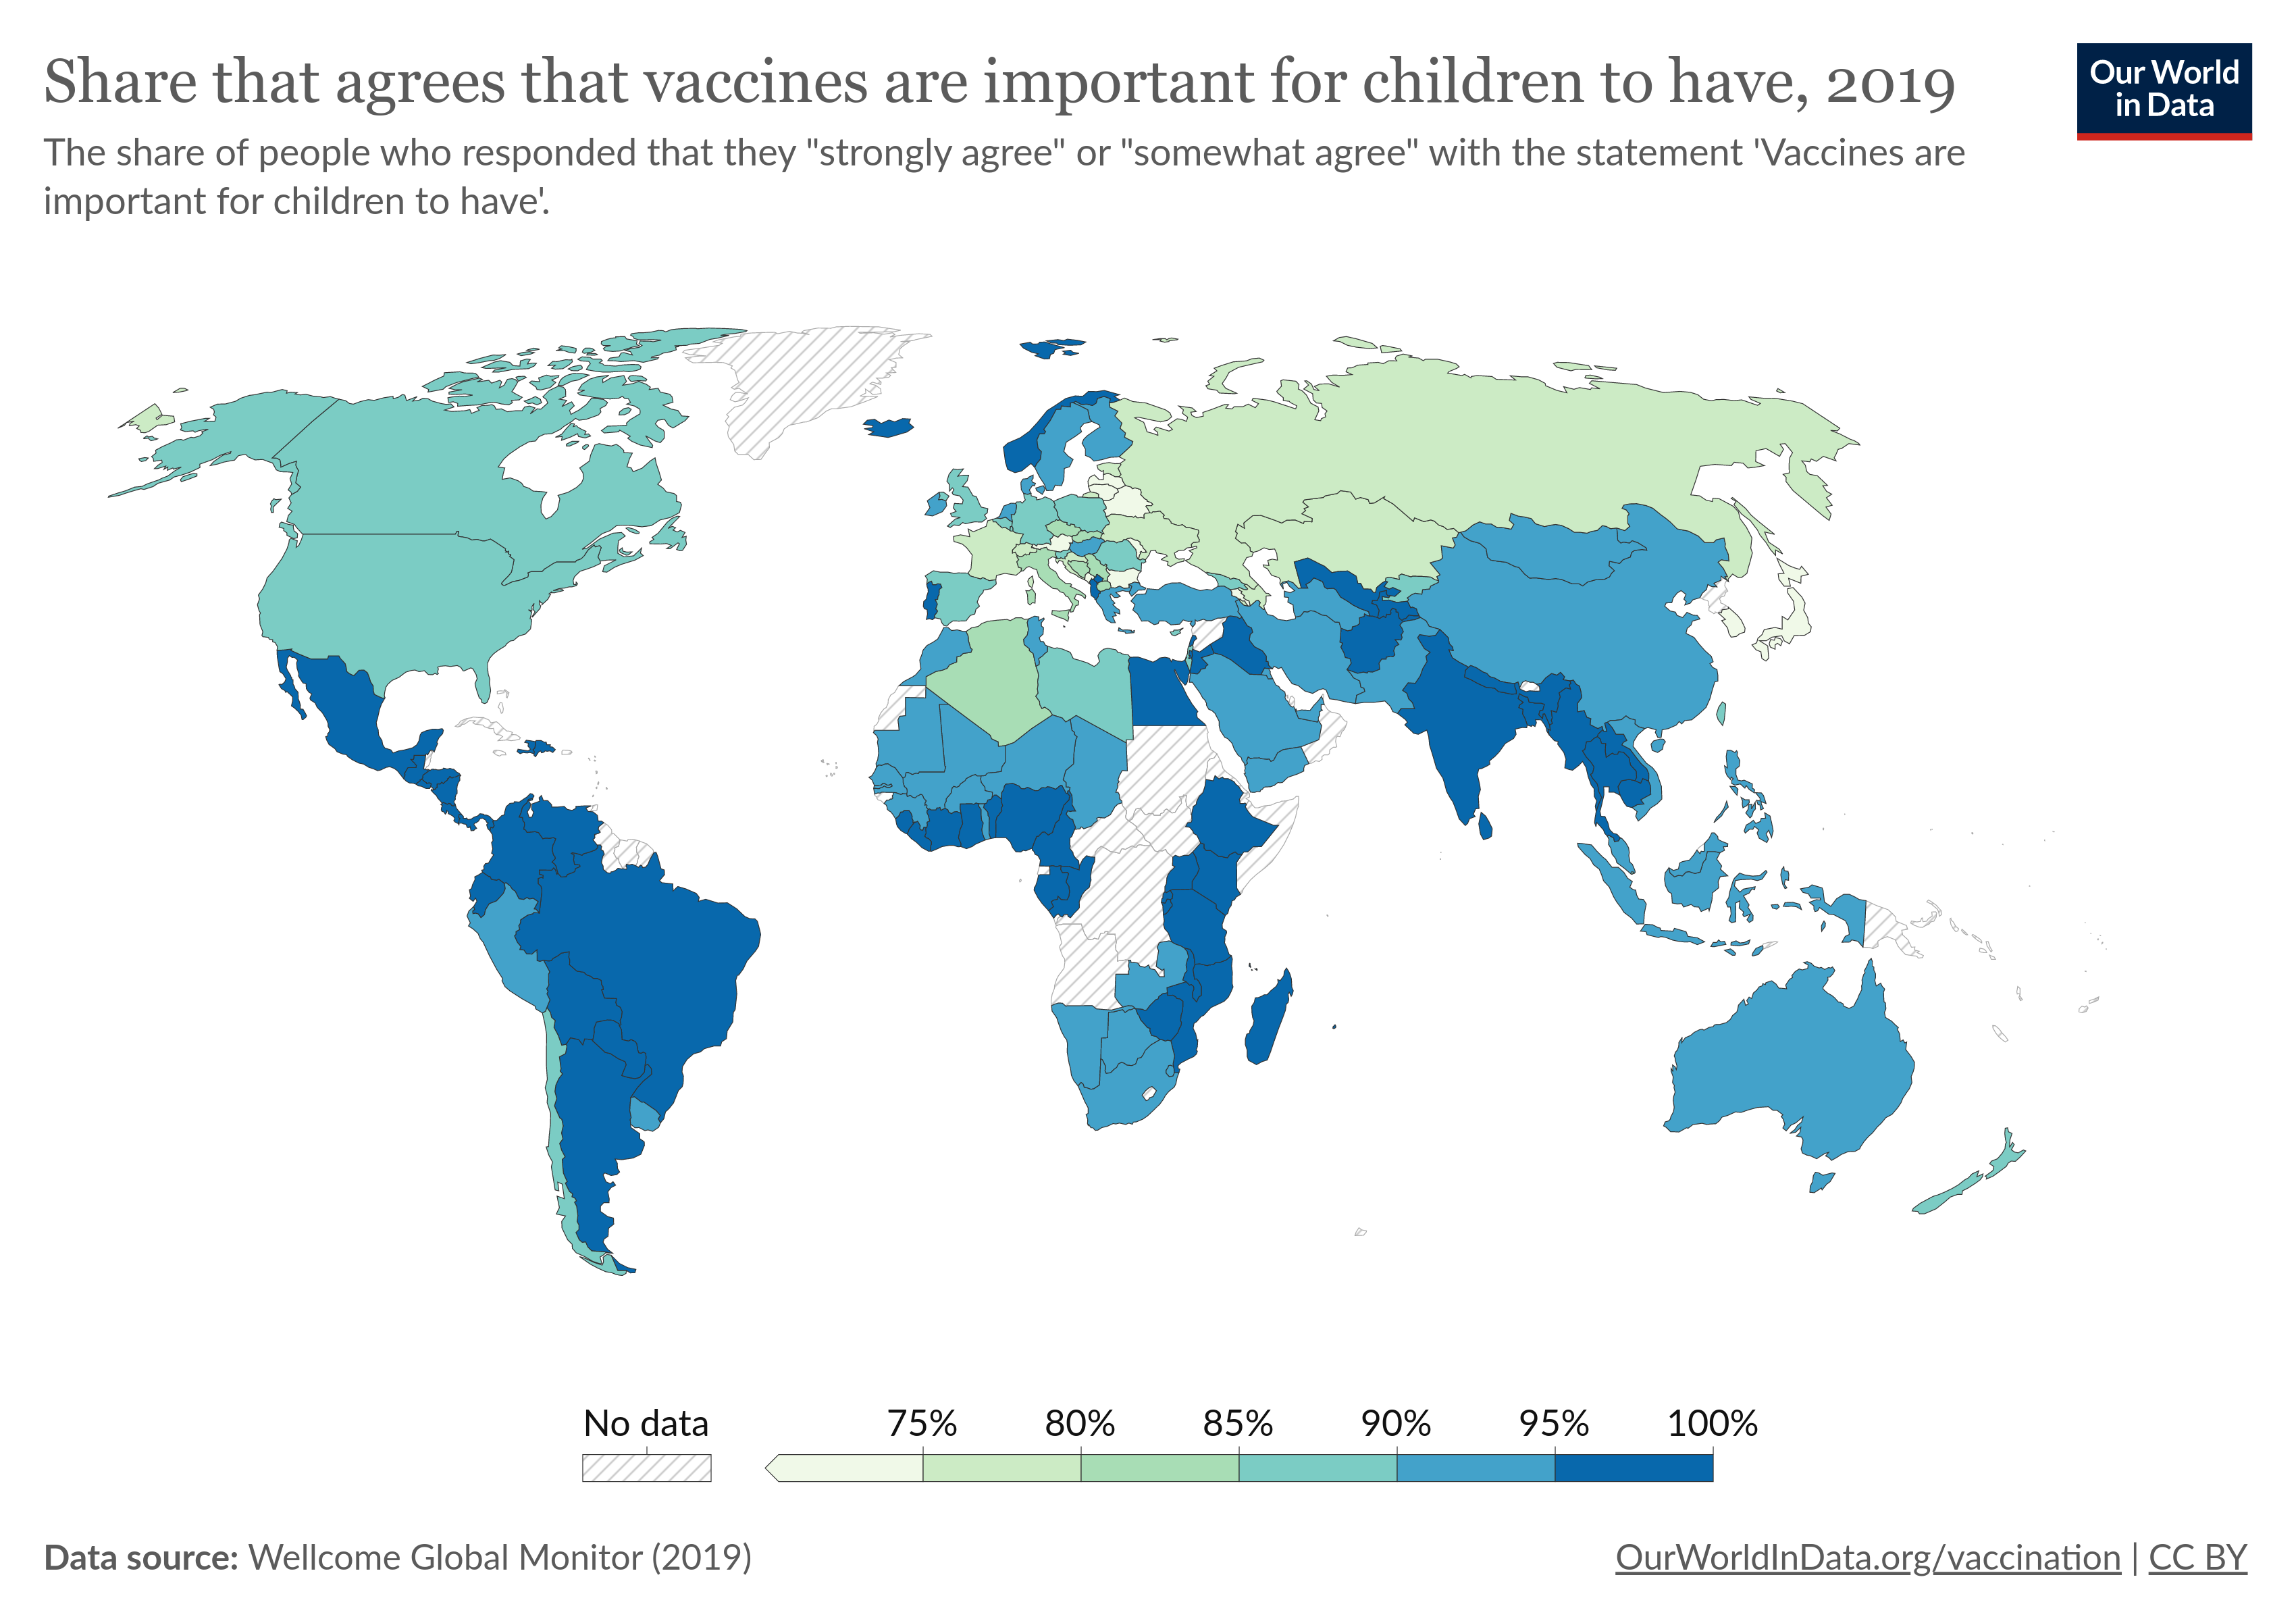
Figure 7.10: Agreement with the asserion that ‘vaccines are important for children to have’, by countries, in 2019, from Our World in Data.
What are the perceived risks of vaccines? Most people do not subscribe to conspiracy theories about vaccine-enabled 5G chips. What they do think is that vaccines can (and actually do) entail health problem in some people. In this representation, these people are innocent victims which a vaccination mandate sacrifices for the good of the larger number of people with no side-effects. In other terms, we are in a Footbridge problem, where the (sure) knowledge that some people will suffer from vaccines is balanced again the perceived number of people saved. This explains part of the resistance against vaccines for Covid-19 or measles, where the effects of the disease are mild in most cases, but dramatic for a small number of affected people.
A behaviourally-informed response to vaccine hesitancy could thus be to change the framing of the problem. Rather than a sacrifice, it can be underlined that not taking a shot — in the absence of known risk factors — is a free-riding behaviour, since you rely on other people being vaccinated to protect you. In a positive way, taking a vaccine can be adequately presented as a cooperative behaviour, for example HPV vaccination for males.
7.7 Changing perceptions
 Figure 7.11: A collage of old ads, with various messages which feel unacceptable now, such as a bay encouraging their mother to smoke a cigarette, or to have a last drink before driving a car.
The key lever on acceptability is thus to change perceptions. We tend to represent perceptions as sticky, and difficult to change, because we think them rooted in moral principles. (Frank 2020Frank, Robert. 2020. Under the Influence. Princeton University Press. https://press.princeton.edu/books/hardcover/9780691193083/under-the-influence.) provides several examples of rapid changes in representations and social norms, which seemed to be deeply rooted. The ads in the margin seem outlandish to us: associating smoking with motherhood, drinking with lactation or driving, or smoking in a plane. These behaviours were seen as normal one or two generations ago.
Robert Frank argues that such large evolutions occur when there is a discrepancy between what people think or do, and what they think other people think or do. I already alluded to his analysis of pre-marital sex and the sexual revolution. Another examples in the book is the support for same-sex marriage in the US. It was as low as 10% in the 1988 US. Although by 2008, the level of support had increased to 40%, Barack Obama and Hilary Clinton still thought safer to argue against same-sex marriage during their campaign. In 2015, the year the US Supreme Court asserted the right of same-sex marriage at a national level (Obergefell v. Hodges), the approbation rate stood at 60%, and 70% in 2023 ((The New York Times 2023The New York Times. 2023. “Cross-Tabs: July 2023 Times/Siena Poll of the 2024 Race and National Issues.” The New York Times: U.S., August 1. https://www.nytimes.com/interactive/2023/08/01/us/elections/times-siena-poll-registered-voters-crosstabs.html.)) with a majority of support over all demographics (including registered Republican voters). According to Frank, this rapid evolution stemmed two interrelated tendencies: (i) the ability for more people to come out, leading their friends and families to recalibrate what being homosexual means (Dick Cheney, whose daughter Mary came out as a lesbian is an example), and (ii) a more positive portrayal of homosexual people in popular media, shifting perceptions and providing role models to come out. At an institutional level, the legal recognition of same-sex marriages by the State of Maryland in 2004 was a watershed moment.
Although is is tricky to generalize from such a specific case, it suggests that behavioural public policy as several levers to nudge perceptions. For example, leaflets about “dos and don’ts with a trans co-worker” could be useful tools, moving the relationship with a trans person from something foreign (“You know a trans person? I don’t” — well maybe you do, but they did not tell you) to something likely enough to happen that someone in the institution took the pains to design and print the leaflet.
7.7.1 Urban cars
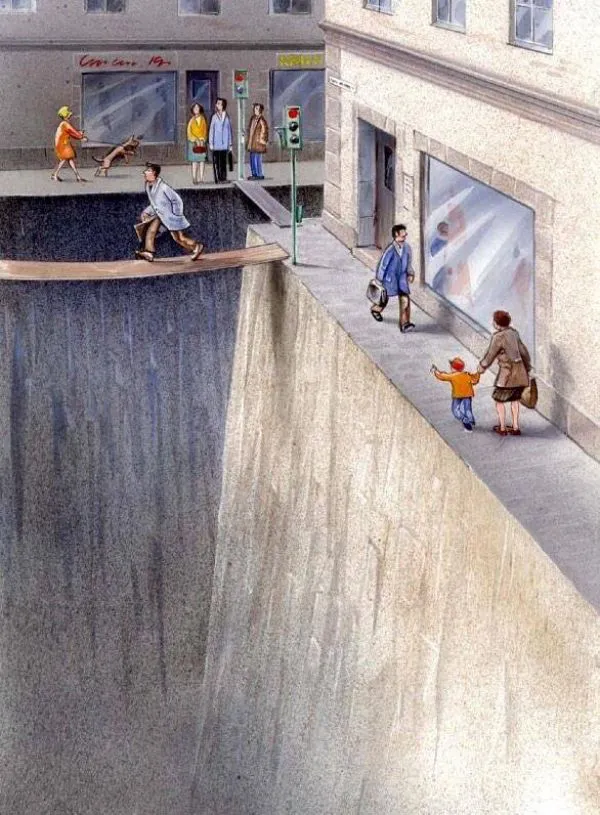 Figure 7.12: Karl Jilg/Swedish Road Administration
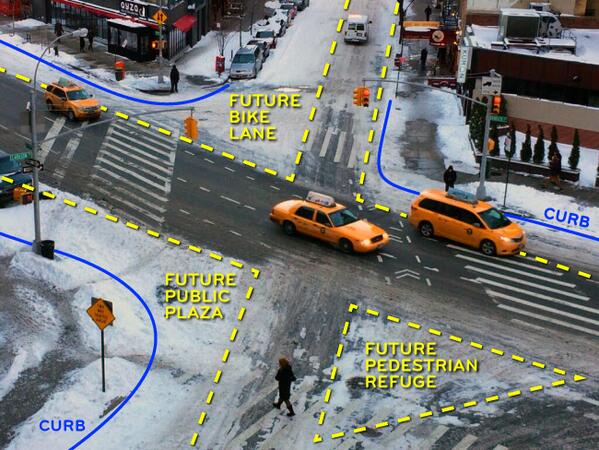 Figure 7.13: A typical sneckdown analysis
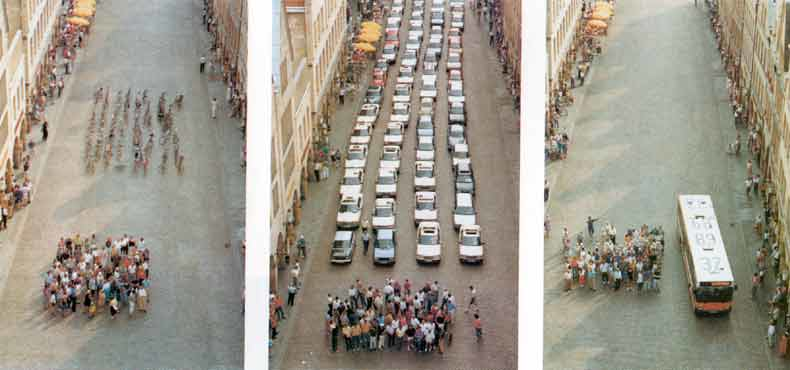 Figure 7.14: Programm fahrradfreundliche Stadt Muenster, 1997
The debate about the space allocated to cars in urban environments is another case rife with behavioural issues. The statu quo bias leads us to take for granted the fact that our cities are designed around cars and cars users’ needs, even if they represent a fraction commutes. In Paris, 50% of total public space is devoted to cars, while only one-third of residents own a car (and many do not use it daily), and they represent less than 15% of travels. Due to their salience, we pay a lot of attention to moving cars (because they are dangerous), under-estimate their passive space occupancy (parking), and over-estimate their occupation rate (because they are big) and efficiency.
This is a case where information provision can be a strong tool to change perception. The first cartoon simultaneously highlights two features:
- The share of public space actually allocated to motorized transportation in a typical city.
- The narrow and precarious nature of the infrastructure enabling pedestrians to move in a car-dominated landscape.
You may of course notice that the representation is one-sided, since the humans travelling within the cars are removed from the picture.
The second figure illustrates the sneckdown phenomenon. The endogenous removal of the snow cover by car traffic shows that cars do not use the full breadth of their allocated space. As a result, some may be repurported for other uses.
The third picture starkly illustrate the space consumption of modes of transportation for the same number of people. Again, the effectiveness of the picture relies on removing key features. Here, the range, degree of autonomy, cost and level of effort differ from one mode of transportation to another. Crafting a behaviourally efficient message means you have to make that kind of trade-off. Ideally, we’d like to acknowledge it elsewhere in the support — what we tried to do in (Abdel Sater et al. 2021Abdel Sater, Rita, Mathieu Perona, Elise Huillery, and Coralie Chevallier. 2021. “The Effectiveness of Personalised Versus Generic Information in Changing Behaviour: Evidence from an Indoor Air Quality Experiment.” SocArXiv, no. kw3tn (September). https://ideas.repec.org//p/osf/socarx/kw3tn.html.).
Alongside the public at large, policymakers are a prime target for this kind of information-conveying campaigns, since the bias in their perceptions have a higher impact on actual policy. This point is powerfully highlighted by a very simple statistic p. 7 of (6t-bureau de recherche 2024). The question, asked in 1999, was:
Do you think car use should be restricted in order to improve traffic in cities?
72% of a representative sample of citizens were in favour of such a restriction, an 68% of mayors. However, the same mayors deemed that on 27% of the citizens would agree to such a measure, preventing them to acting on their own conviction.
This case illustrates the many-pronged approach behavioural design can bring to the table, from correcting misrepresentations about other peoples’ beliefs, to design communication support in order to make salient the unfairness or inefficiency of the current allocation of space.
7.8 Bottom line
The acceptance of policies, small and large, is driven by fairness norms much more complex than narrow self-interest, and even narrow self-interest is prone to misinformation and erroneous beliefs. As behavioural policy designers, we should know the fairness norms applicable in the fields we operate in, and we have the ability to sway perceptions using behaviourally-designed tools.
7.7.2 Social systems
The relevance of perception is not limited to local issues. Perception shape our assessment of fundamental policy design, which we mistake for fundamental choices in society. We thus know that public support for social welfare differs across countries. It is notably low in the US, while in most European countries, the concept of a medical bankruptcy is abhorrent (and the basic plot of the Breaking bad series does not make sense). We often ascribe such differences to differences in moral judgement, on what is right or wrong, and our moral duties to each other — otherwise, how could American accept to deny care to someone because that person cannot pay?
However, there is not much difference between Europe and the US in terms of pure moral judgement, at least as evidenced in the trolley problems experiments we just saw. Research rather suggests that the difference lies in perception. (Aarøe and Petersen 2014Aarøe, Lene, and Michael Bang Petersen. 2014. “Crowding Out Culture: Scandinavians and Americans Agree on Social Welfare in the Face of Deservingness Cues.” The Journal of Politics (United Kingdom) 76 (3): 684–97. https://doi.org/10.1017/S002238161400019X.) took two samples, one of US people, the other of Danish people. Denmark has a strong welfare protection, with a cultural background more similar to the US (Protestantism, liberalism) than other countries from continental Europe. They measure the opposition to the idea that the State should help a person in need across three conditions:
The Neutral condition reflects our preconceptions about average countries position on the welfare state: 57% of US persons opposed helping in the neutral case, against 49% of Danish people. However, information about the case led the assessment to converge: opposition to helping the lazy recipient was high in both groups (76% and 79% respectively), and low when it came to the unlucky person (36% and 35% respectively). In both cases, the difference between Americans and Danish is not statistically significant.
Th experimenters used free word association to collect information about a priori representations of welfare recipients. US respondents were much more likely to say that welfare recipients are lazy, while Danish respondents saw then as victims of bad luck and circumstances. In other words, there is no fundamental difference in moral assessment of welfare recipients in well-specified cases, but a strong divergence on the general representation of welfare recipients. This implies that large-scale changes on social models can be enacted through changes in representations — first and foremost by providing accurate information — without impinging on moral grounds.